CFU IS GOING BACK TO
PNC PARK
Click Here For More Info
Invest Today: Earn 4.5% with our Choice Two Program!
Click Here For More Info
Welcome!
Welcome to the Croatian Fraternal Union of America where more than a century of fraternalism has been achieved by providing members with a competitive, high-quality, modern portfolio of life insurance protection and savings opportunities.
Dobro nam došli!
Welcome to the Croatian Fraternal Union of America where more than a century of fraternalism has been achieved by providing members with a competitive, high-quality, modern portfolio of life insurance protection and savings opportunities.
Events
CFU offers members a variety of fraternal programs on the national, regional, and local levels. [Go]
Why Choose CFU?
With a legacy of fraternal service, find out why CFU is the right choice for you and your family. [Go]
Sheet Music Library
Now, our Sheet Music Library is available to our members OnLine. Register for Access today! [Go]
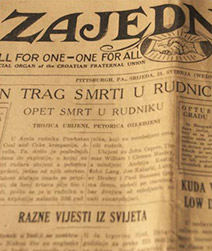
Zajednicar
Take a moment to read the CFU President’s Column/Lead story from the most recent edition of the Zajedničar. [Go]